Vasp2Visual 🟢
ipyvasp 🔴
Interactive Plot
Jupyter Notebook
Grid Plot

Vasp2Visual
A Pre/Post processing PowerShell Module for Vasp output. Scripts allow user take full control of their vasp output data. You can plot on your own by just getting data in column format through using the command
Export-VaspRunin a folder containingvasprun.xml.
- You are strongly recommended to download STIX Fonts to make your plot fonts similar to article’s fonts.
- You need to install various python module including numpy, matplotlib and for interactive plots, you need to install Plotly.
- The few of available commands include the following.
PS> Get-Command -Module Vasp2Visual
CommandType     Name                                               Version    Source
-----------     ----                                               -------    ------
Function        Enable-SelectiveDynamics                           1.0.3.0    Vasp2Visual
Function        Export-LOCPOT                                      1.0.3.0    Vasp2Visual
Function        Export-VaspRun                                     1.0.3.0    Vasp2Visual
Function        Get-FillingWeights                                 1.0.3.0    Vasp2Visual
Function        Get-Summary                                        1.0.3.0    Vasp2Visual
Function        Get-EigenVals                                      1.0.3.0    Vasp2Visual
Function        Get-KPath                                          1.0.3.0    Vasp2Visual
Function        Merge-ToSlab                                       1.0.3.0    Vasp2Visual
Function        Get-FigArgs                                        1.0.3.0    Vasp2Visual
Function        New-Figure                                         1.0.3.0    Vasp2Visual
Function        New-Presentation                                   1.0.3.0    Vasp2Visual
Function        Out-Path                                           1.0.3.0    Vasp2Visual
Function        Read-BigFile                                       1.0.3.0    Vasp2Visual
Function        Write-BigStream                                    1.0.3.0    Vasp2Visual
- Alternative to this is a python module ipyvasp which you can use with full flexibility in Jupyter.
- Powershell wrapper commands for
pivotpyare available now! Interact with plots in below links!
Interactive Plot
Jupyter Notebook
Grid Plot
Plot using New-Figure command
There are multiple switches for interactive and static plots including sRGB, iRGB etc. You can access all switches and parameters using Tab.
Note: You need python >= 3.6 to use this command and pivotpy module. ```powershell ❯ Get-Help New-Figure
NAME New-Figure
SYNTAX New-Figure [[-sRGB]] [-VasprunFile
New-Figure [[-iDOS]] [-VasprunFile <Object>] [-FigArgs <hashtable>] [-SaveHTML <Object>] [-SaveMinHTML <Object>][-SavePyFile <Object>] [<CommonParameters>] ```
❯ $x = Get-FigArgs -sBands
Name                           Value
----                           -----
kseg_inds                      []
figsize                        (3.4, 2.6)
xytxt                          [0.05, 0.9]
txt                            None
ktick_inds                     []
E_Fermi                        None
elim                           []
skipk                          None
ctxt                           'black'
ktick_vals                     []
❯ New-Figure -VasprunFile 'E:\Research\graphene_example\ISPIN_2\bands\vasprun.xml' -sBands -FigArgs $x -SavePDF 'fig.pdf' -SavePyFile 'fig.py'
You can edit the saved python file for further tweaking. Also note that if you want a string placed in python, like ctxt = 'red' in Get-FigArgs, you have to modify it as $x.ctxt = " 'red' ", double qoutes for powershell and single qoutes will be written in python file.
❯ New-Figure -sRGB -AfterCode "ax.set_ylabel('')`nax.grid(axis='x')`nplt.subplots_adjust(left=0.2)"
  #This will add following lines after plot command:
    ax.set_ylabel('')
    ax.grid(axis='x')
    plt.subplots_adjust(left=0.2)
  #Use powershell's new line character `n instead of pythons's \n in code. Keep track of indentation too.
PS❯ Export-VaspRun -InputFile .\vasprun.xml -SkipK 10 -MaxFilled 5 -MaxEmpty 5
# You can add switch -OnlyDOS to this function.
Piping in Powershell
In a big project where you have multiple files in same depth (or anyway you can think of) You can use pipe operator to avoid for loops and run data or save figures in all folders by just running 1 liner.
PS❯ Resolve-Path **/**/vasprun.xml | Export-VaspRun
# This exported 4 files in one run
PS❯ Resolve-Path **/**/vasprun.xml | New-Figure -sBands -SavePNG 'myfig.png'
# This saves figures in corresponding directories.
Use Get-POSCAR to acess POSCAR from Materials Project
You need Materials Project API to access their data. Function will return a list of available POSCARs for given structure. Access data using get_poscar from pivotpy directly on remote server. To save APIKey for autolad, open python terminal and use pivotpy.sio.save_mp_API('your_api_key'), in that case you do not need to provide api key yourself each time.
❯ $x = Get-POSCAR 'GaAs' -APIKey '*****' -MaxSites 8
❯ $x[0].poscar
GaAs  # Generated by PivotPy using Materials Project Database.
  4.06599269
     1.0000000000000000     0.0000000000000000     0.0000000000000000
     0.5000000000490150     0.8660254037561398     0.0000000000000000
     0.5000000000490150     0.2886751346042458     0.8164965780265512
  Ga  As
  1   1
Direct
  0.00000000    0.00000000    0.00000000  Ga
  0.75000000    0.75000000    0.75000000  As
PS> $x=Read-BigFile -FilePath E:\Research\Current\pDOS.txt -StopIndex 5
PS> Write-BigStream -StreamArray $x -FilePath E:\Research\Current\new.txt -AsOneLine
- Note: Both
Read-BigFileandWrite-BigStreamrequires full file path to work properly but they reslove relative path as well. These functions are useful to parse big files like LOCPOT which otherwise are timely expensive.
Get-IntoYourWorkStation
- Launch your Powershell console and run
Set-ExecutionPolicy Unrestricted. This will allow you to run scripts.
Direct Install (Not recommended, its behind github)
- For direct install from Powerhell Gallery, follow link Vasp2Visual@PSGallery and follow guidlines or run the command below in the console
Install-Module Vasp2Visual
#Click Y for what prompts in console.
Download from Github (Recommended for latest updates)
- Find the path to Powershell Module by running
$env:PSModulePathcommand and then download the directory Vasp2Visual in that path. There are usually three paths.PS> $env:PSModulePath
C:\Users\mass_\Documents\WindowsPowerShell\Modules;
C:\Program Files\WindowsPowerShell\Modules;
C:\WINDOWS\system32\WindowsPowerShell\v1.0\Modules
After Installation Steps
- Running
Import-Module Vasp2Visualin Powershell console will make all commands in this module available to use. If you want to make it permanent, include this import command in your powershell profile by typyingyour_editor $PROFILE. - Now run
Get-Modulecommand. This will show you that Vasp2Visual is ready and you can see list of commands.
- You need vasprun.xml file to collect data. It is recommended that if you have
vasprun.xmlfile from DOS calculations,put that file in a folder nameddosorDOSin the root folder where vasprun.xml is present from a bandstructure calculation andrun plotting commands only in root folderbut runExport-VaspRunin each folder in case of BandDOS composite plots.
Get-FunctionsWork
To import Vasp2Visual and see if it is available in current session, run
PS> Import-Module Vasp2Visual
PS> Get-Module  #will give all imported modules including the one you just imported
Script 1.0.0.0 Vasp2Visual {Close-Writers, Get-KPath, Get-Plot, Get-PlotArguments...}
To permanently import it into your profile, run the following cmdlet
PS> "Import-Module Vasp2Visual"|Add-Content $PROFILE
If you are working in WSL on windows, you probably encounter switching between windows and linux terminals, so here is a function that changes the current windows directory path into Linux and LaTeX path formats.
PS> Out-Path -AbsolutePath ./GaAs
Name                           Value
----                           -----
LinuxPath                      /mnt/Full Path Required for WSL./GaAs
LatexPath                      ./GaAs
PythonPath                      ./GaAs
OnClipboard                    /mnt/Full Path Required for WSL./GaAs
#So you need absolute path to enter in WSL from powershell. LaTeX path is fine.
Get-KPath
Vasp2Visual contains a cmdlet for creating a K-Path before you run a calculation on vasp(HSE specifically). You can provide path to IBZKPT file to include as well.
❯ Get-Help Get-KPath
SYNTAX
    Get-KPath [-HSK_Array] <array> [[-n] <int>] [[-Labels_Array] <array>] [[-Weight]
    <Object>] [[-OutFile] <Object>] [[-IBZKPT_File] <Object>] [<CommonParameters>]
❯ Get-KPath -HSK_Array @(((1,3,4,5),(2,3,4)),((1,3,4),(2,3,4))) -Labels_Array "l","g|k","x"
Automatically generated using PivotPy with HSK-INDS = [0, 5, -1], LABELS = ['l', 'g|k', 'x'], SEG-INDS = [5]
	15
  ...
If you have disconnected path, you need an array as in above example, each path is just a pair of two points. If you only require single path patch, use 2D array as given below:
❯ Get-KPath -HSK_Array @((1,3,4,5),(2,3,4),(1,3,4),(2,3,4)) -Labels_Array "l","g","k","x"
Automatically generated using PivotPy with HSK-INDS = [0, 5, 15, -1], LABELS = ['l', 'g', 'k', 'x'], SEG-INDS = []
	25
  ...
Another aspect of Get-KPath is that you can have custom number of points in an interval, just add a 4th entry in left point as I added 5 in first point. Otherwise parameter -n is number of points per unit length and all kpoints are uniformly distributed based on distance of intervals.
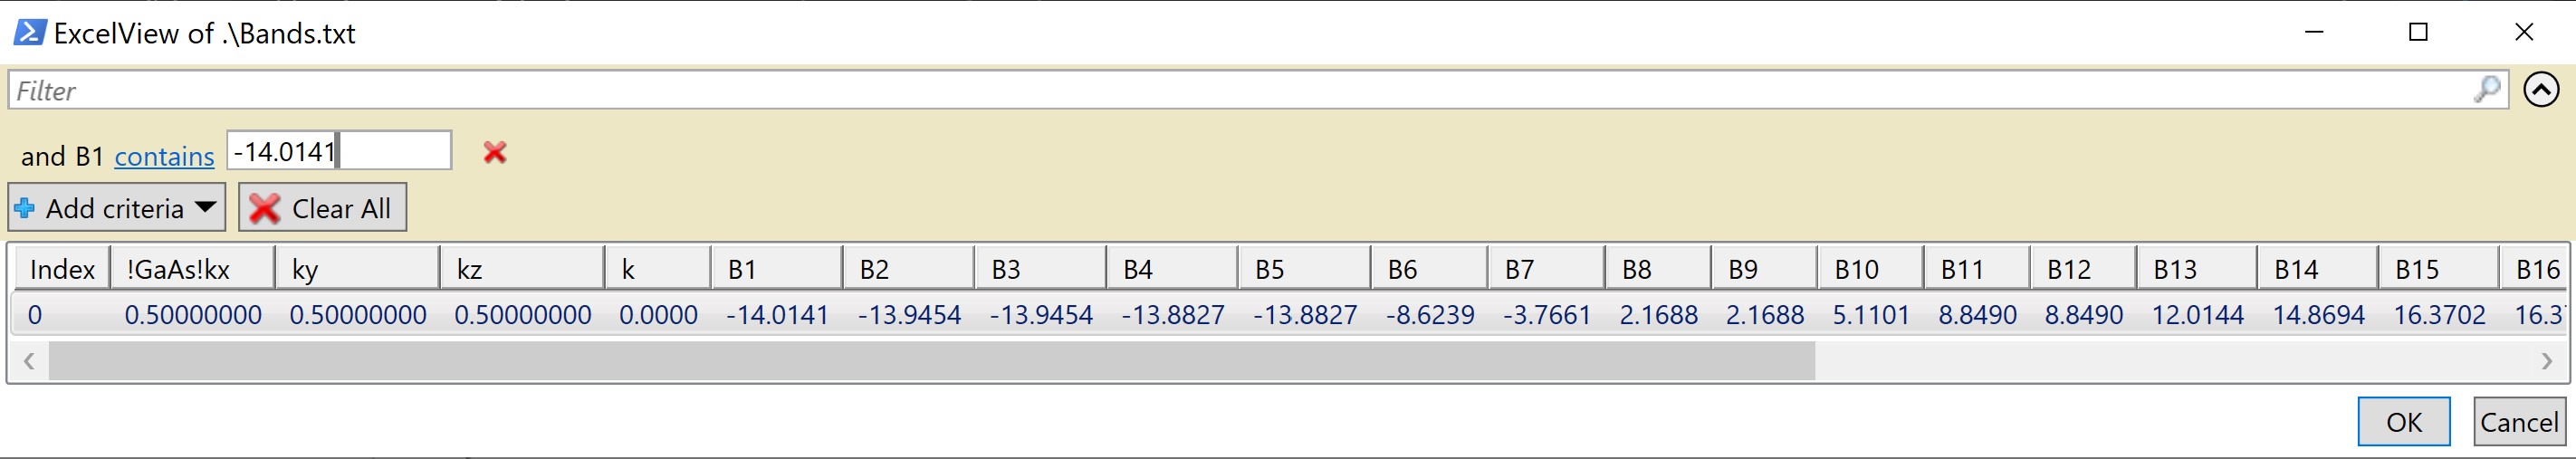
For accessing any entry of a tabular data file, you can use the following command
PS> Format-DataInFile .\Bands.txt -ViewAsExcel -DispalyFewColumns -SelectColumns 1,2,3,4,5
which gives output in an Excel-like window as shown below. You can apply sorting operation in this window and much more. Theoretically you can see any file this way without opening any editor or a big program like Excel.
In case you want to access a data entry in column_5, you can view it as an indexed dataframe.
PS> (Format-DataInFile .\Bands.txt).B1[0]
    -14.0141
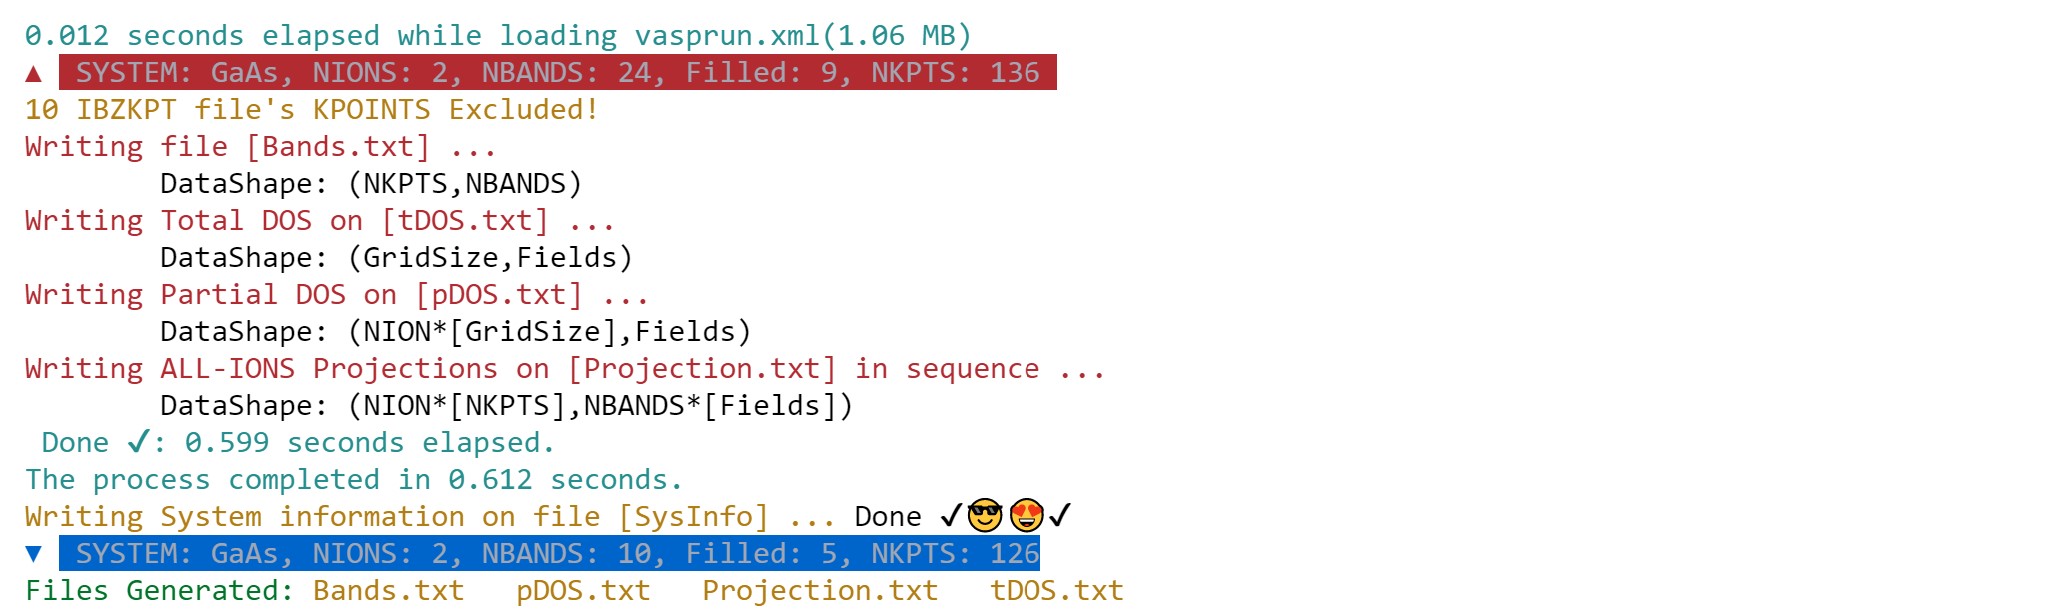
Collect-VaspData
In order to collect data from vasprun.xml, run the command
PS> Export-VaspRun
#For a system with NBANDS > 40, it will prompt to select a range of bands
[SYSTEM] structure contains  64 ions and 780 bands.
 [To get all bands, Type 530, 250] ⇚ OR ⇛ [Collect almost ↑↓ 30 bands around VBM]
 Seperate entries by a comma: e.g. 530, 250
 NBANDS_FILLED, NBANDS_EMPTY: 15,10
This will make 4 files,
Bands.txt, tDOS.txt, pDOS.txt, Projection.txtand aSysInfo.pyfile that can be imported in python directly. Projections are written ion-wise in same file.
If running the above cmdlet throws an error and stops running, then you must run the following command
PS> Close-Writers #This will close all opened stream writers.
Now you are able to use your own plotting method to get output, but you can instead use Get-Plot function to let it work automatically for you. Before going forward, lets get to know how many arguments are available and then you can just edit arguments.
PS> $x=Get-PlotArgs  # Use switches -DOS,-Plotly, Default retrurn is for basic plots.
PS> $x.E_Limit="[-10,15]" #sets your defined energy limit in plot
PS> $x.ticklabels  #will show up ticklabels and you can edit
#After editing all keys in $x.Key for your system, you can run the following cmdlet to get plot
PS> Get-Plot -ProjectedBandDOS -PlotArguments $x #will output a plot. You can add -HalfColumnWide switch to make small size plots.
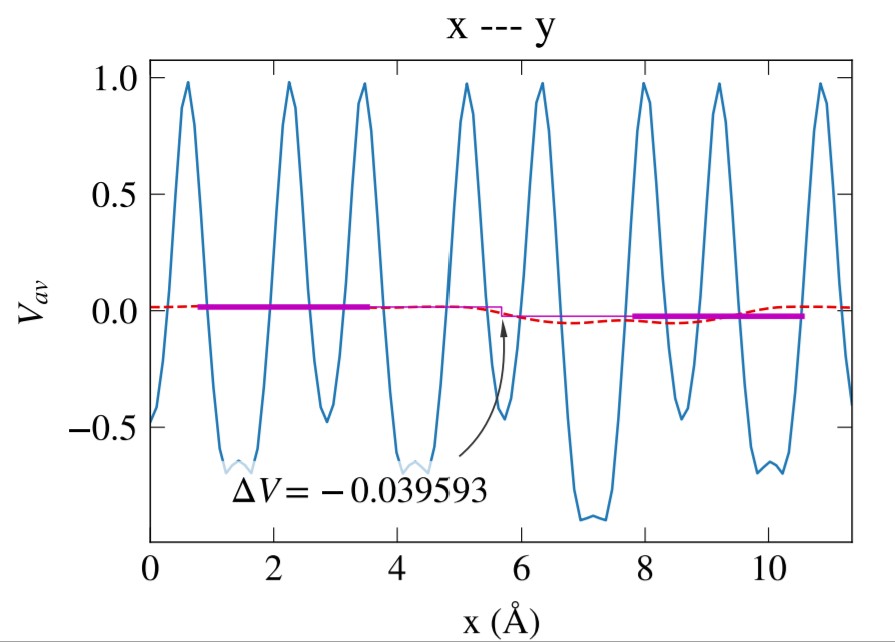
Export LOCPOT file into seperate x,y,z-directed potentials using
PS> Export-LOCPOT #Creates three plane data files consisting minimum,maximum and average potential in each direction.
PS> Get-ConvolvedPotential -X_Dir -V_max -Interval 1,20 #gives interactive plotly graph in html format.
PS> Get-AlignedPotential -Z_Dir -V_min -LeftRightPositions 0.25,0.75 -Periodicity 28 -LeftRightNames 'left','right'
- Periodicity can be obtained by
Get-ConvolvedPotentialwith plotting over a guessed range of interval.
Aligned potential looks like the below one.
Get-PublicationsReadyPlots
- Seperate and composite plots can be made using switches like
-Bands,-BandDOS,-ProjectedBands,-ProjectedBandDOS. Plot size could be decreased to half of an article column width by using-HalfColumnWideswitch. You can make your own plots from data.
Get-More
The most useful cmdlet is
Get-InteractivePlotbased on Plotly. You can interact with html graph, can switch between simple and projected plots and can get coordinates visually.
Here is how it works.
PS> $x=Get-PlotArgs -Plotly; $x
Name                           Value
----                           -----
tickIndices                    [0,30,60,90,-1]
ticklabels                     [u'\u0393','M','K',u'\u0393','A']
E_Limit                        [5,-5]
ProLabels                      ['Ga','s','p','d']
ProIndices                     [(range(0,1,1)),(0,),(1,2,3,),(4,5,6,7,8,)]
You can edit any key, and get plot using the cmdlet
PS> Get-InteractivePlot -PlotlyHashTable $x
If you have disconnected K-path, you can join it in figure automatically be using
$x.JoinPathAt="[break points indices array]"in plot arguments$x=Get-Args -switches. Say we have'L'and'M'points at index19,20and do not have kpoints between them, we can just set$x.JoinPathAt="[20]"and plotting function will do the job automatically.
- You can plot DOS with three differnt switches
-LinePlot,-AreaPlotandStackPlot. In addition you can use-HalfColumnWideswitch to make less wide plot. Usage:PS> $x=Get-PlotArgs -DOS; $x
Name                           Value
----                           -----
textLocation                   [0.05,0.9]
DOS_Limit                      [0.0,0.6]
FigureHeight                   2.5
E_Limit                        [5,-5]
ProLabels                      ['Ga','s','p','d']
ProIndices                     [(range(0,1,1)),(0,),(1,2,3,),(4,5,6,7,8,)]
You can edit any key using $x.key="value" and get DOS plot using the cmdlet
PS> Get-DensityPlot -LinePlot $x -HalfColumnWide
Required files not found. Generating using 'Export-VaspRun' ...
Files now exist. Plotting ...
Get-Automated
- Script for converting LOCPOT into plane and plottable data formats is here now! Use
Export-LOCPOTfunction.
- Make Slab in z-direction (make sure none of
POSCARhave zx,zy,xz,yz non-zero i.e angle c should be 90, otherwise result will be wrong. Rotate POSCAR in pure z-direction using Vesta before inputting here and after making slab, rotate it back. Also planes should have complete site, e.g. out of 8 sites in plane, if 4 are at z=0 and 4 at z=0.97, this will results in wrong merge.
PS> Merge-ToSlab -FirstPOSCAR .\slab.vasp -SecondPOSCAR .\slab.vasp #Merges two POSCARS in z-direction
Only Cubic and Tetragonal POSCARs are supported.
Make sure your POSCARs DO NOT have non-zero xz,yz,zx,zy elements,
If so, first rotate POSCAR using Vesta.
File [POSCAR_New.vasp] created.
- This will enable/disable selective dynamics at given sites.
PS> Enable-SelectiveDynamics -InputPOSCAR .\POSCAR.vasp -SelectSitesNumber 1,2,5
File [POSCAR_eSD.vasp] is created.
PS> Disable-SelectiveDynamics -InputPOSCAR .\POSCAR_eSD.vasp
File [POSCAR_dSD.vasp] is created.
- This cmdlet gets sites number for a layer with given z coordinate value upto 2 decimal place. These sites could be input to
Enable-SelectiveDynamics.PS> Select-SitesInLayers -InputPOSCAR .\POSCAR.vasp -Array_2Decimal 0.00,0.25
XY_PlaneSites YZ_PlaneSites ZX_PlaneSites
------------- ------------- -------------
{1, 2, 5, 6}  {1, 4, 6, 7}  {1, 3, 5, 7}
- This is good only for slabs with number of layers less than 100 as two decimal places are slected. For more than 100 layers in z-direction, either use
Enable-SelectiveDynamicswith explicit sites number provided or contact me to make the script flexible. The number of layers less than 100 is kept on purpose, when we dope a single element in a slab, coordinates are displaced a little and it seems like a new layer. But no issue here, because you will not miss your selected layer as long as you use first two decimals (without rounding).
- You can get X,Y,Z coordinates of layers in a POSCAR for input argument in
Select-SitesInLayerscmdlet by using the command.PS> Show-LayersInfo .\Conventional.vasp
X_AtLayers               Y_AtLayers               Z_AtLayers
----------               ----------               ----------
{0.00, 0.25, 0.50, 0.75} {0.00, 0.25, 0.50, 0.75} {0.00, 0.25, 0.50, 0.75}
- Automation functions are here to boost the productivity. For example, to know band gap, spin-orbit split-off, use the following functions.
PS> Show-BandInfo 9 #returns information about band as output below.
Name                           Value
----                           -----
Minimum                        -0.1617
Maximum                        3.3817
BandNumber                     9
K_min                          75
K_max                          25
PS> Get-IndexedPlot 30,-20 -xTickDistance 25 #Creates the plot with bands and k-point indexed as givnen in figure below.

PS> Find-GapOfBands 10 9 #returns band gap.
Above command Can return bandwidth if smaller index is first say 9 10, or of same band 9 9. This is extemely useful to find the Bandwith between VBM and Minimim value of energy on lowest band. try:
PS> Find-GapOfBands 1 9
17.4247
BandWidth (1 → 9): 17.4247 eV is copied to clipboard.
- This is extremely useful to get
Spin-Orbit split-off. Just input a single argument consisting 2 points(k1_index,BandNumber1),(k2_index,BandNumber2)with no space.PS> Measure-Distance -K1B1_K2B2 (25,8),(25,7) #return distance between any two points on k-E plane. Below is return of Above command.
Name                           Value
----                           -----
Point_1                        {0.8660, 3.3817}
Point_2                        {0.8660, 3.3817}
Distance                       0
Distance: 0 [dimensionless] is copied to clipboard.
Present-It
The Beamer-Timer is available as standslone repository but it is included in this package as well. You can get a beamer presenatation file immediately in your working folder by running
PS> New-Presentation -Blank #or use -Template switch
This will generate a main.tex file. You can create a loop in powershell to make slides automatically for your all pictures in subdirectories.
You will get a bonus Reveal-Markdown directory containing a
reveal.mdfile and a thememyserif.css. If you have vscode-reveal extension installed on VSCode, you can create interactive HTML presentation just using markdown and can also convert it to PDF and static HTML website like revealjs.