Quickstart
![]()
[1]:
import numpy as np
import matplotlib.pyplot as plt

import ipyvasp as ipv
Transform POSCAR
Let’s create some dummy POSCAR.
[2]:
poscar = ipv.POSCAR.new(
    [[0.5, 0.5, 0.0], [0.0, 0.5, 0.5], [0.5, 0.0, 0.5]],
    {"Ga": [[0.0, 0.0, 0.0]],"As": [[0.25, 0.25, 0.25]]},

    scale = 5
)

poscar.write("POSCAR",overwrite=True) # need it later

site_kws = dict(alpha=1)
ax1, ax2, ax3 = ipv.get_axes((8,3),ncols=3, axes_3d=[0,1,2])

poscar.splot_lattice( ax = ax1, fill = False,label='original',
    site_kws=site_kws)

_ = poscar.transform(lambda a,b,c: (b+c-a, a+c-b, a+b-c)).transpose([1,2,0]) # bring a1 to x
print(poscar.last.data.metadata.TM)
poscar.last.splot_lattice( # .last points to last created POSCAR in transform
    ax=ax2, fill = False, color='red', label='transformed',
    site_kws=site_kws
)
poscar.last.splot_plane([1,1,0],1/2,ax=ax2)

poscar.transform(lambda a,b,c: (a-c,b-c,a+b+c)
).set_zdir([0,0,1]).splot_lattice(ax=ax3,color='red')

print(poscar.last.data.metadata.TM)
ax1.view_init(azim=-25, elev=15)
ax2.view_init(azim=-35, elev=15)
[[0.  0.5 0.5]
 [0.5 0.  0.5]
 [0.5 0.5 0. ]]
[[ 0.66666667 -0.33333333  0.33333333]
 [-0.33333333  0.66666667  0.33333333]
 [-0.33333333 -0.33333333  0.33333333]]

[3]:
poscar.splot_bz(fill = True,color='skyblue', vectors=None,lw=0.1).set_axis_off()
ax = poscar.splot_kpath([(0,0,0), (1/4,1/2,-1/4), (0.5,0.5,0), (0,0,0), (0,0.5,0)],
    labels = ['Γ', 'K', 'X', 'Γ', 'L'], fmt_label=lambda lab: lab+'\n')
ax.view_init(azim=55, elev=25)

[4]:
fig = poscar.iplot_bz(color='blue')
ipv.iplot2html(fig)
[4]:
K-Path
We can interplate kpath based on current POSCAR, it gives correct distance between points.
[5]:
poscar.get_kpath([
    (0,0,0,'Γ'),
    (1/4,1/2,-1/4,'K'),
    (0.5,0.5,0,'X'),
    (0,0,0,'Γ'),
    (0,0.5,0,'L')
    ], n=8)
Automatically generated using ipyvasp for HSK-PATH 0:Γ, 4:K, 5:X, 9:Γ, 12:L
        13
Reciprocal Lattice
    0.0000000000    0.0000000000    0.0000000000    0.076923
    0.0625000000    0.1250000000   -0.0625000000    0.076923
    0.1250000000    0.2500000000   -0.1250000000    0.076923
    0.1875000000    0.3750000000   -0.1875000000    0.076923
    0.2500000000    0.5000000000   -0.2500000000    0.076923
    0.5000000000    0.5000000000    0.0000000000    0.076923
    0.3750000000    0.3750000000    0.0000000000    0.076923
    0.2500000000    0.2500000000    0.0000000000    0.076923
    0.1250000000    0.1250000000    0.0000000000    0.076923
    0.0000000000    0.0000000000    0.0000000000    0.076923
    0.0000000000    0.1666666667    0.0000000000    0.076923
    0.0000000000    0.3333333333    0.0000000000    0.076923
    0.0000000000    0.5000000000    0.0000000000    0.076923
[6]:
poscar.get_kmesh(2,2,2, weight=0)
Generated uniform mesh using ipyvasp, GRID-SHAPE = [2,2,2]
        8
Reciprocal
    0.0000000000    0.0000000000    0.0000000000    0.000000
    1.0000000000    0.0000000000    0.0000000000    0.000000
    0.0000000000    1.0000000000    0.0000000000    0.000000
    1.0000000000    1.0000000000    0.0000000000    0.000000
    0.0000000000    0.0000000000    1.0000000000    0.000000
    1.0000000000    0.0000000000    1.0000000000    0.000000
    0.0000000000    1.0000000000    1.0000000000    0.000000
    1.0000000000    1.0000000000    1.0000000000    0.000000
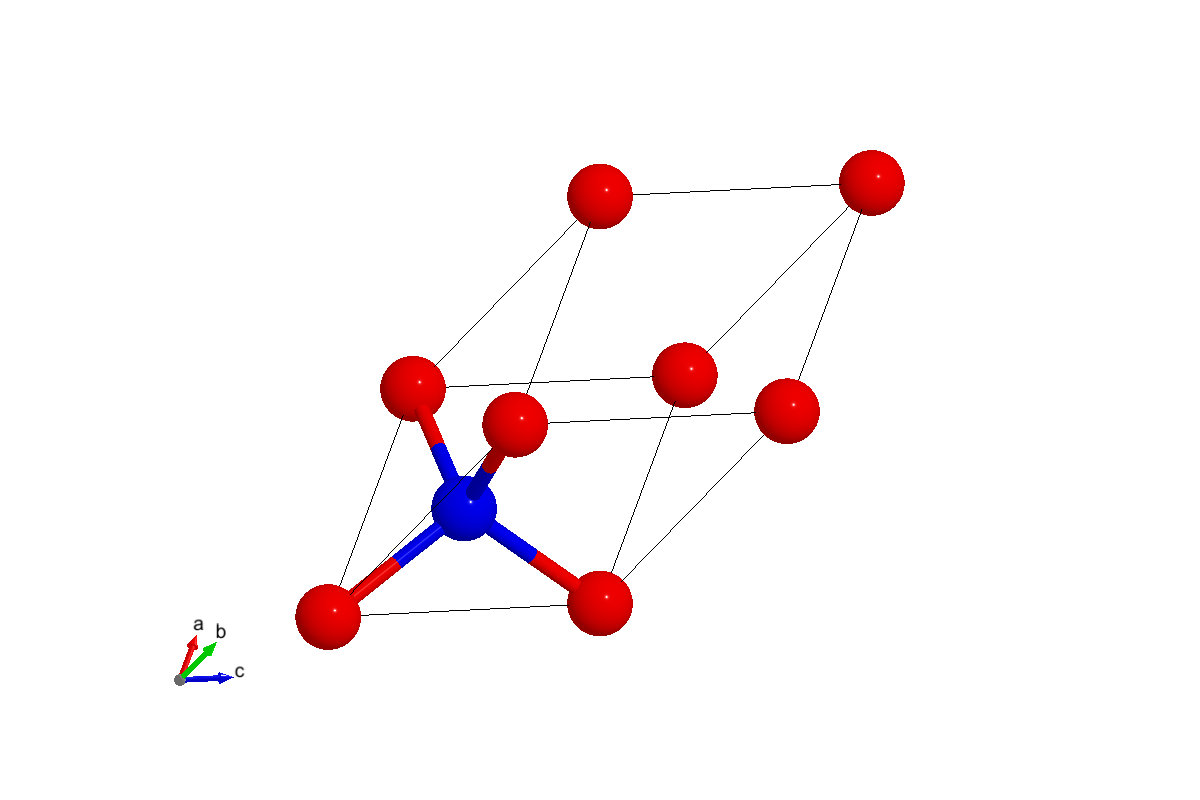
[7]:
view = poscar.view_weas(colors={'Ga':'red','As':'blue'})
view
[7]:
If you are not seeing interactive widget above, don’t worry! We’ve got you covered with a screenshot below:
[ ]:
view.download_image('weas.png')
Live View of POSCAR Operations

Batch analysis using Files class.
[8]:
files = ipv.Files('.')
files
[8]:
Files(
  WindowsPath('POSCAR'),
  WindowsPath('quickstart.ipynb'),
  WindowsPath('weas.png')
) 3 items
[9]:
files.summarize(lambda path: {'end': path.parts[-1]})
[9]:
| end | FILE | |
|---|---|---|
| 0 | POSCAR | POSCAR |
| 1 | quickstart.ipynb | quickstart.ipynb |
| 2 | weas.png | weas.png |
[10]:
files.map(lambda p: p.suffix,to_df=True)
[10]:
| 0 | 1 | |
|---|---|---|
| 0 | POSCAR | |
| 1 | quickstart.ipynb | .ipynb |
| 2 | weas.png | .png |
[11]:
files.interactive(lambda file: print(file))
[11]:
[12]:
files.filtered('py')
[12]:
Files(
  WindowsPath('quickstart.ipynb')
) 1 items
Example: View Lattice and BZ side by side
[13]:
import plotly.graph_objects as go
import ipyvasp as ipv
fs = ipv.Files('.','POSCAR')

@fs.interact(fig1 = go.FigureWidget(), fig2 = go.FigureWidget(),
    post_init = lambda dash: dash.set_layout(
        left_sidebar = ('file', 'fig2'),
        center = ('fig1',),
        pane_widths = [2,3,0],
    )
)
def view(file, fig1, fig2):
    pos = ipv.POSCAR(file)
    ipv.iplot2widget(pos.iplot_bz(), fig_widget=fig2)
    ipv.iplot2widget(pos.iplot_lattice(), fig_widget=fig1)

[ ]: