ipyslides
Create Interactive Slides in Jupyter Notebook with all kind of rich content. https://asaboor-gh.github.io/ipyslides/
 IPySlides



IPySlides is a Python library for creating interactive presentations in Jupyter notebooks. It combines the power of Markdown, LaTeX, interactive widgets, and live variable updates in a single presentation framework. DOI
Why IPySlides?
The Problem: Static PowerPoint vs. Superficial Notebook Relayouts
Scientists, engineers, and programmers are trapped between two frustrating extremes. PowerPoint forces you into a dead, non-interactive workflow of pasting static screenshots and endlessly duplicating slides just to reveal a single bullet, equation, or figure element. Conversely, traditional notebook-based presentation tools are nothing more than superficial cell wrappers; they simply relayout your raw notebook cells without providing any native content support, structural design, or layout control. This forces you to awkwardly chop your analysis into dozens of artificial cells just to trigger basic fragments. Moreover, their static exports often break, leaving you without a reliable backup if your live Python kernel is not available.
The Solution: An Interactive, Content-Aware Ecosystem
IPySlides embeds a frame-aware presentation engine directly into your computational workflow, letting you run your full analysis and build high-fidelity slides side-by-side in the same notebook.
By replacing copy-paste duplication and artificial cell chopping with programmatic framing, a single cell acts as a canonical source that natively understands structure, progressing in precise, incremental steps. It keeps execution code, rich outputs, and custom layouts perfectly synchronized while supporting active Jupyter widgets for real-time data manipulation. When it’s time to export, it generates a production-grade HTML or crisp PDF backup that accurately mirrors your presentation.
A Practical Win: Reuse Publication Figures Without Rework
Fixed 210 mm (8.3 in) slide width means paper/report figures usually drop in with little or no resizing. You never have to make two figures again, one for publication and one for presentation.
Features
- 📊 Support for plots, widgets, and rich media
- 📐 210 mm (8.3 in) width: just reuse paper figures
- 🎨 Customizable themes and layouts
- 📱 Responsive design for various screen sizes
- 📤 Export to HTML/PDF (widgets are no more interactive)
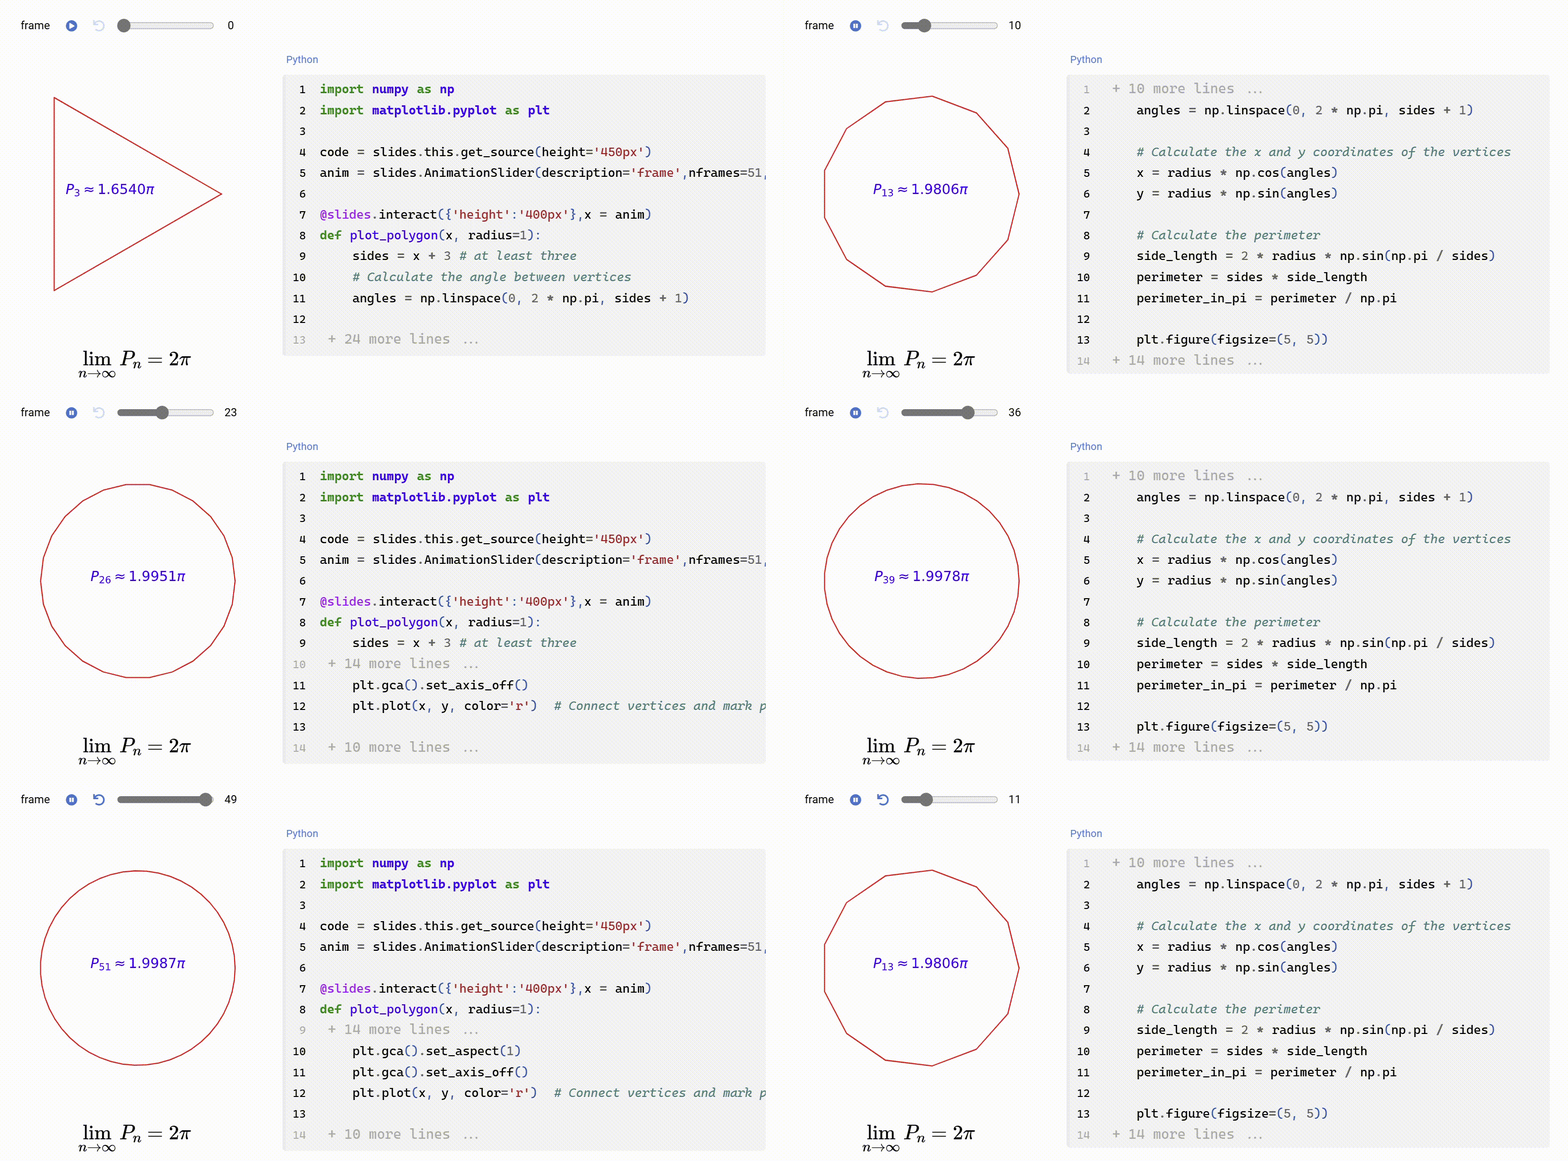
- 🎯 Frame-by-frame animations
- 📝 Speaker notes support
- 🔄 Extended Markdown, citations and settings files synchronization
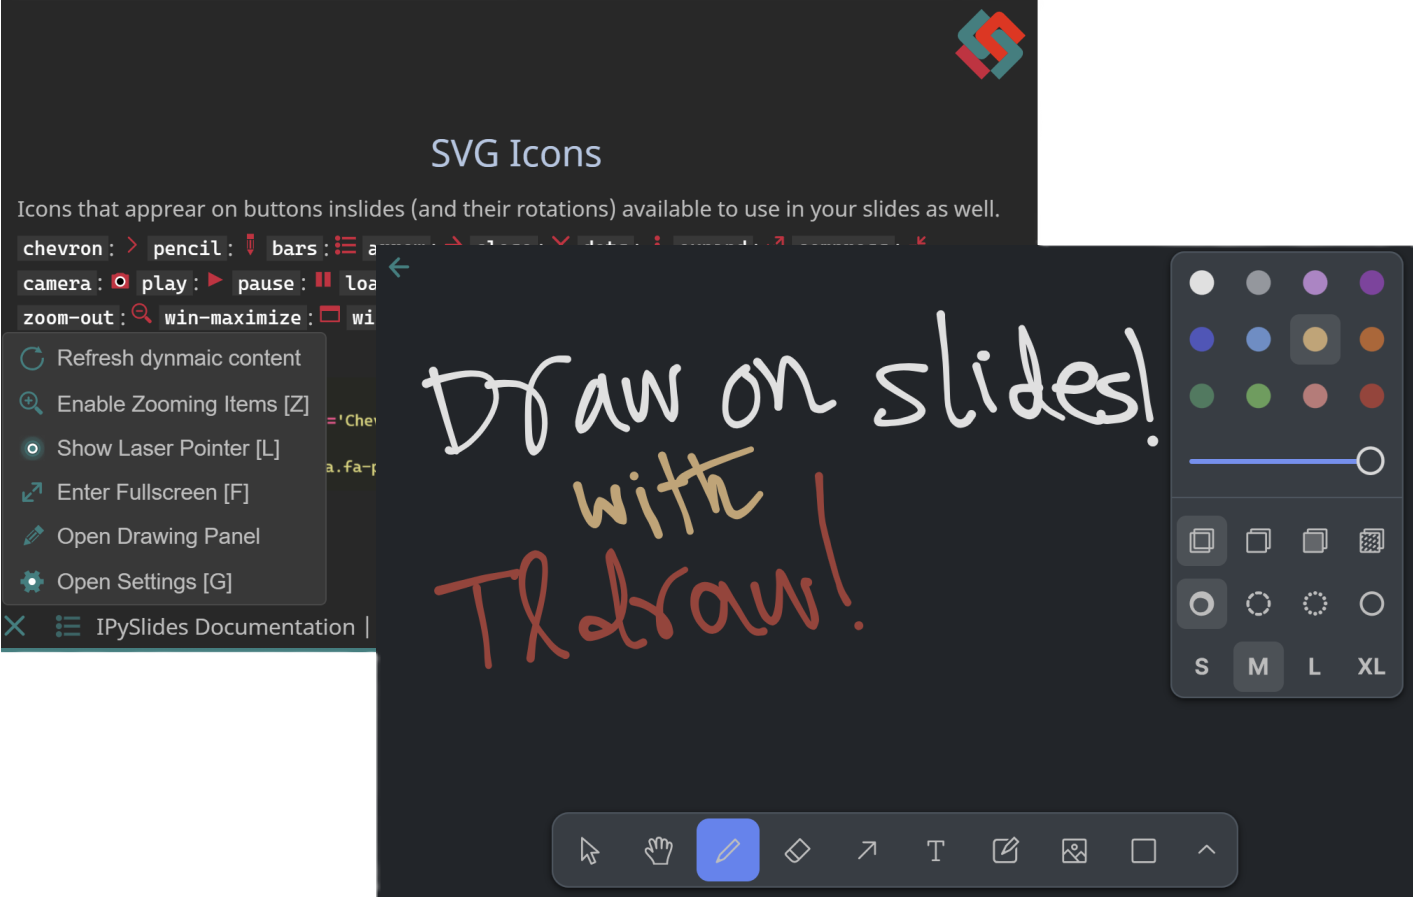
- ✏️ Drawing support during presentations
Quick Start
Install:
pip install ipyslides        # Basic installation
pip install ipyslides[extra] # Full features
Create Slides:
import ipyslides as isd
slides = isd.Slides()

# Add content programmatically
with slides.slide(-1):
    slides.src("""
    # My First Slide
    - Point 1
    - Point 2
    $E = mc^2$
    """)

# Or use cell magic
%%slide 0 -m
# Title Slide
Welcome to IPySlides!
Run Examples:
isd.docs()  # View  and interact with documentation
isd.demo()  # See and interact with demo presentation
✨ Try it in your browser ✨
View Static Notebooks
Content Types
Support for various content types including:
- 📜 Extended Markdown, see
slides.xmd.syntax - 📊 Plots (Matplotlib, Plotly, Altair)
- 🔧 Interactive Widgets
- 📷 Images and Media
- ➗ LaTeX Equations
- ©️ Citations and References
- 💻 Auto update variables in markdown
- 🎥 Videos (YouTube, local)
- 🎮 Enhanced interactive widgets (with fullscreen support, thanks to
anywidget)
import numpy as np
from ipywidgets import HTML

@slides.dl.interact(html = HTML(), amplitude= (0, 2),frequency=(0, 5))
def plot(html, amplitude, frequency):
    x = np.linspace(0, 2*np.pi, 100)
    y = amplitude * np.sin(frequency    * x)
    plt.plot(x, y)
    html.value = slides.plt2html(). value
-
For comprehensive dashbords, see DashLab and try it out in
-
And much more!
Export Options
-
HTML Export
Useslides.export_htmlto build static slides that you can print to PDF. Read export details in settings panel, where you can also export with a single click. -
PDF Export Support for direct PDF printing from slides with visuals that perfectly match the live notebook presentation is available using
Ctrl + P(use options in side panel to prepare for print), although some IDEs like VSCode may not allow it. UseSave as PDFand enable background graphics if necessary. If issues arise in direct printing, export to HTML first and print from there.
See demo.pdf for an example exported PDF.
Advanced Features
- Custom Objects Serialization:
- You can serialize custom objects to HTML using
Slides.serializerAPI. - You can extend markdown syntax using
Slides.extenderAPI. See some good extensions to add from PyMdown.
- You can serialize custom objects to HTML using
- Inline Python Function:
- You can register inline functions using
xmd.registerand use already register functions with syntax[func! content .. *args, **kwargs/]/[func!! *args, **kwargs .. content /]. - See
xmd.syntaxandxmd.funcsfor details on inline function. - These functions support nesting and can show any IPython content.
- You can register inline functions using
-
Speaker Notes: Enable via Settings Panel → Show Notes and add notes via
slides.notes. - Custom Styling:
slides.css({ 'p': {'font-size':'1.2em', 'line-height':'1.5'}, # relaxed paragraph }, applyto=1, bg1 = '#f0f0f0') # set theme color on slide 1, or 'all' or list of slides -
File Sync: Live edit a linked markdown file that updates slides in real-time using
slides.sync_with_file. - Content Animations:
- Slides builders now support skeleton animation automatically for a premium editing experience.
- Beside slides switch transitions, you can animate content anywhere in slides using
anim-prefixed classes and related varaiables. Seeslides.css_animationsfor details.
Caveats
- Markdown Cells:
- Jupyter markdown cells are not processed by IPySlides
- Instead, you can use
%%slide number -mcell magic and link an external markdown file usingslides.sync_with_file
- Slide Numbering:
- Use
-1for automatic slide numbering - Manual numbering requires careful tracking to avoid overwriting slides
- Use
- Speaker Notes:
- Experimental feature - use with caution
- Notes appear at top of slide in PDF to grab speaker’s attention and are meant for speaker reference only, e.g. printed handout.
- Place extended projector on top/bottom of laptop screen while presenting in Jupyter Notebook to allow right/left edges click navigation work smoothly.
Development
git clone https://github.com/asaboor-gh/ipyslides.git
cd ipyslides
pip install -e .
Contributing
Contributions are welcome! Please feel free to submit a Pull Request.
Documentation
- Interactive Documentation: Use
ipyslides.docs()in any notebook to create and interact with documnetation. - Interactive Demo: Use
ipyslides.demo()for demo notebook. - Github Pages